Growing demand for office space is driving down vacancy rates in CBDs across Australia, with Melbourne and Sydney at decade-lows, according the latest Property Council Australian Office Market Report.
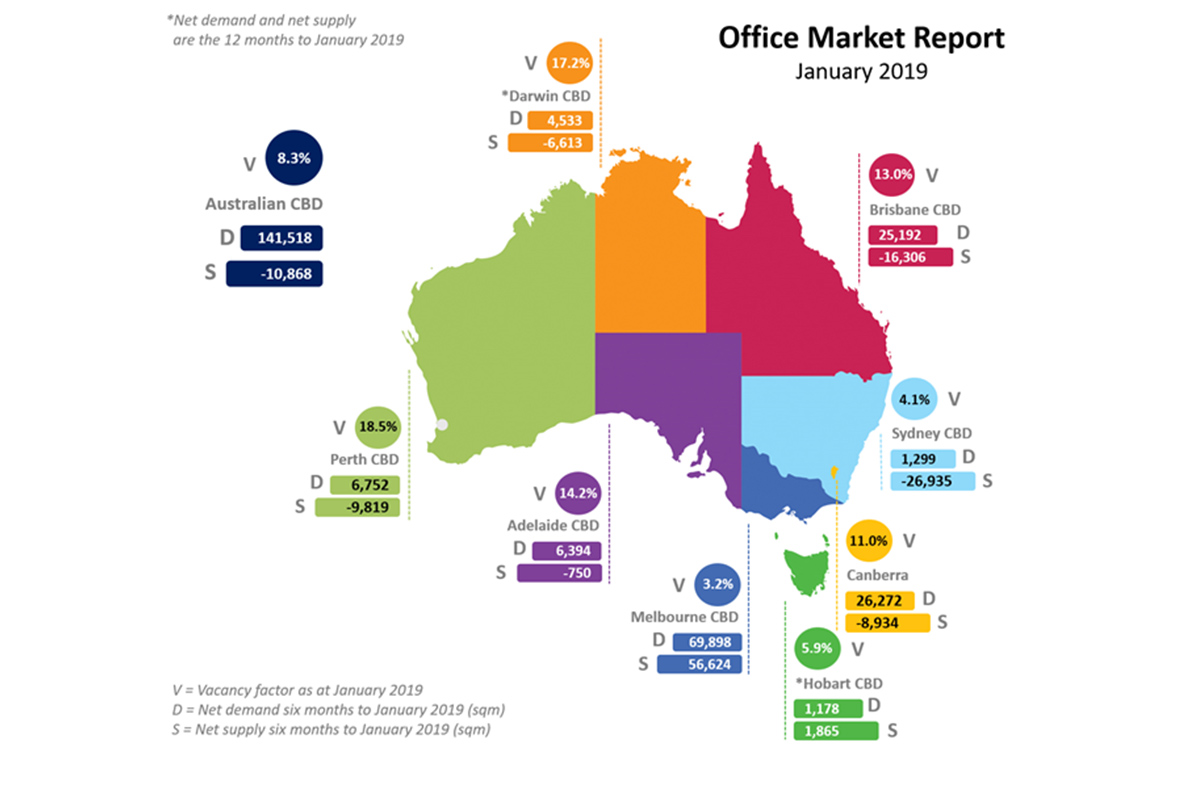
Overall, Australian office vacancy fell by 0.7 per cent in the six months to January 2019 to 8.5 per cent.
The tightest markets are the Melbourne CBD where the vacancy rate fell to 3.2 per cent (down from 3.6 per cent) and Sydney CBD which dropped to 4.1per cent (down from 4.6 per cent). They were accompanied by falls in vacancy in all capital cities other than Hobart.
“Office vacancies have tightened in CBDs across the country, with Melbourne and Sydney now at incredibly low levels,” said Ken Morrison, Chief Executive of the Property Council of Australia.
“While their headline vacancy results are similar, the supply and demand dynamics of Sydney and Melbourne are really a tale of two cities.
“Both markets have strong economic fundamentals, but the Melbourne CBD has seen both strong supply of new office space and strong demand for that space. In the Sydney CBD the combination of a net withdrawal of office space and a tight market has left demand nowhere to grow into.
“Melbourne CBD added an additional 98,758 sqm of supply during the last six months compared to Sydney’s 28,212 sqm increase.
“Looking ahead, Melbourne will account for half of the additional one million square metres of office space coming onto the Australia’s CBD markets over the next three years,” Mr Morrison said.
Across the country, there has been a decrease in office vacancy rates in all capital city markets (except Hobart), including in higher vacancy markets.
Net tenant demand has increased in both CBD and non-CBD markets, with positive demand in CBD markets for the ninth consecutive period.
The national CBD office market vacancy rate fell to 8.3 per cent (down from 9.1 per cent in the previous period) which is its lowest level since January 2013.
The office market vacancy rate in non-CBD markets also fell slightly to 9.1 per cent (down from 9.2 per cent in the previous period).
Melbourne and Sydney were followed by Hobart with the next lowest CBD vacancy rate of 5.9 per cent (previously 5.8 per cent); Canberra 11 per cent (down from 12.4%); Brisbane 13 per cent (down from 14.7 per cent); Adelaide 14.2 per cent (previously 14.7 per cent); Darwin 17.2 per cent (down from 21.6 per cent); and Perth 18.5 per cent (down from 19.4 per cent).
Melbourne and Hobart were the only capital cities to report positive net supply for the period.
The top ten best performing non-CBD markets are all in New South Wales and Victoria: Parramatta, East Melbourne, Macquarie Park, Crows Nest / St Leonards, Chatswood, St Kilda Road, North Sydney, Newcastle, Wollongong and Southbank. The Sunshine Coast, West Perth and Brisbane Fringe have the highest non-CBD vacancy.
Net absorption was 159,092 sqm during the six months to January 2019, which is on par with the historical average of 158,614 sqm. 243,436 sqm of office space was added during the six months to January 2019, below the historical average of 314,066 sqm. A total of 246,472 sqm was withdrawn over the period, compared to the historical average of 159,726 sqm.
Almost 1million sqm of office space will be added to Australian CBD markets over the next three years, with half of this new space being supplied to the Melbourne market which will grow by more than 10 per cent of its current stock.
The Sydney CBD will see an extra 4 per cent of current stock added through to 2021, followed by Brisbane CBD (4.4 per cent), Canberra (3.2 per cent) and Adelaide (5.1 per cent).
For more analysis and commentary by markets, visit the Property Council Data Room at http://research.propertycouncil.com.au/data-room